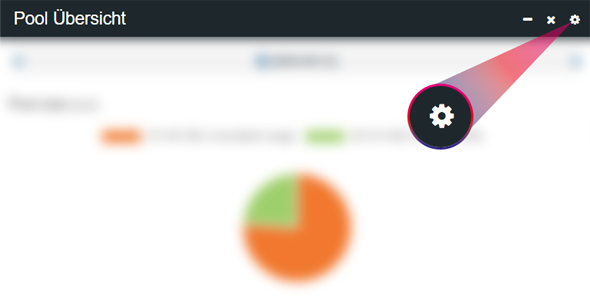
To expand your existing dashboard or to fill newly created dashboards, please select “Add graph to dashboard” in the upper right area of the myFUSION portal.

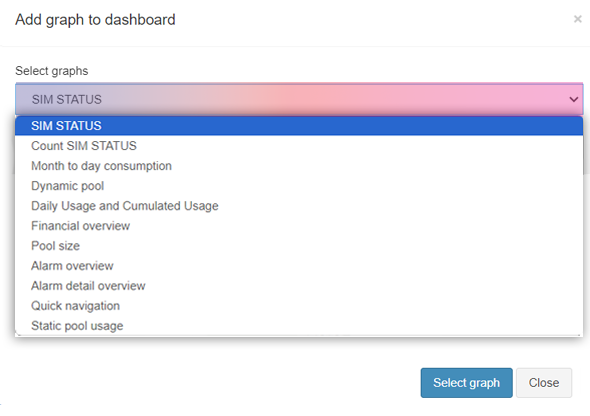
Select a graphic and click on “Select graph”.
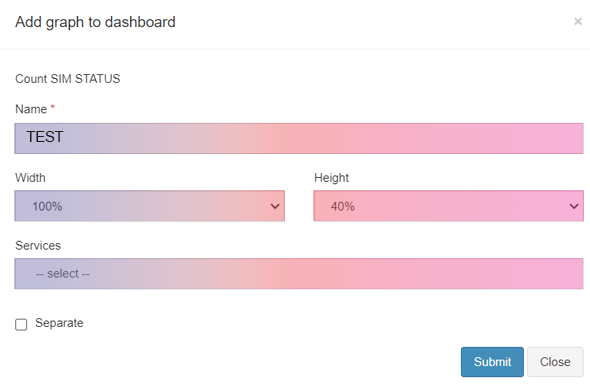
You can enter a name for your graphic in the “Name” tab. You can set the size of the graphic in the “Width” and “Height” tabs. In the “Services” tab, specify which tariff is to be monitored in the graphic. Then click on “Submit”.
You can change the settings of your graphics at any time. To do this, go to the dashboard you have created and click on the cogwheel in the top right-hand corner of the relevant graphic.